Posts Tagged ‘Departmental Database’

We have less than a week with Year 11 left in our school!

For some, that is a cause for celebration; others of emotional goodbyes; for yet others, it is a moment of terror asking themselves “Have we completed the course yet?!”

And with the OCR deadline for CAT marks looming on Wednesday, this is the weekend when finally and completely it is possible to say to all our students:

This is where you stand. These marks are safe and banked (subject to external moderation).

And it is – broadly – possible to take the next step and say (with all the caveats and warnings about Ofqual, Michael Gove and grade boundaries after the GCSE fiasco last year)

These are the marks you need to get this grade overall.

marks left to grade boundaries

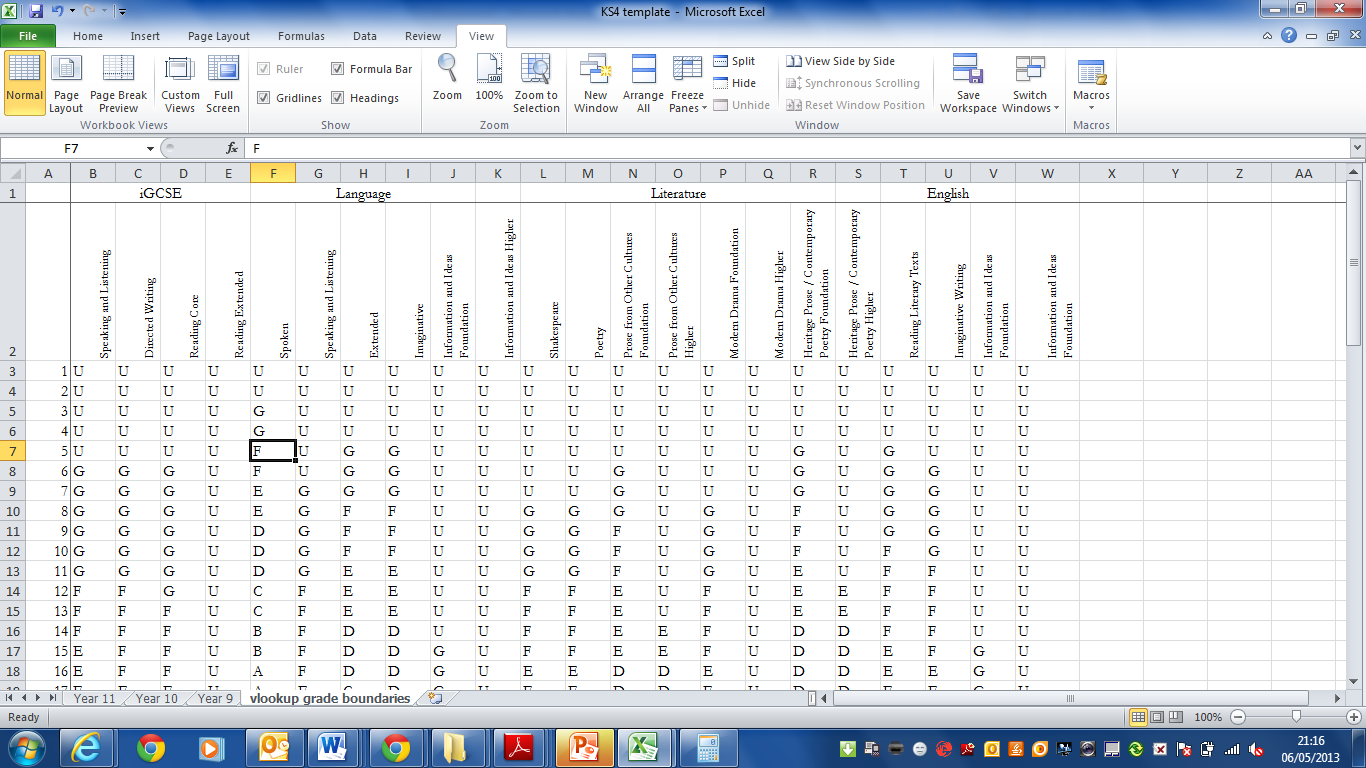
I am basing the maths here on the June 2012 OCR Grade Boundaries for raw scores which can be found here. I ummed and ahhed about perhaps adding a couple of marks to the boundaries to insulate us against the vagaries of Ofqual… but I decided that there was little to be gained from trying to second guess what appears to be a particularly volatile set of politics so left it as it was.

With the additional tweak (a particularly geeky and SLT-friendly tweak!) of colour coding on a scale of 0-80 in English and Language and 0-40 in Literature, we have a nice visual record of who is more and less likely to obtain the A and C grades. Thanks to Excel, the deeper the shade of green, the closer the student is to the boundary; the deeper the shade of red, the further away they are.

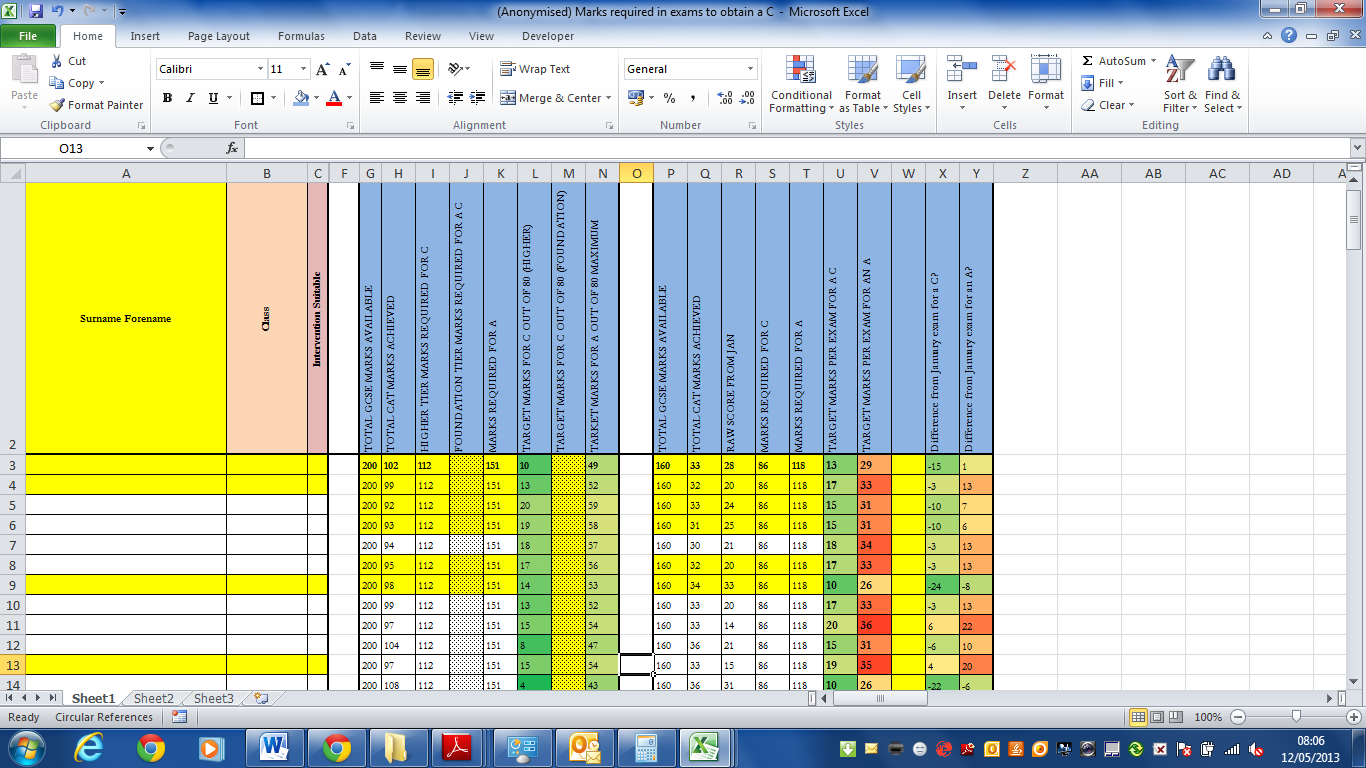
We also put our students doing Literature in to take the Prose from Other Cultures examination in January. so the final two columns simply compare the scores required to get a C or an A with what they obtained in January. Again, it is colour coded: green shows that they need less than they obtained in January; red shows that they need to raise their game. The deeper the shades of colour reflect how far from their January achievement they are: a nice deep green suggests that they need actually far less than they obtained in January to reach that threshold; a deep red suggests they need to up-their-game a lot!

If this would be useful to anyone out there, the (appropriately anonymised) document is linked here with the OCR grade boundaries.

(Anonymised) Marks required in exams to obtain a C

Students at this point respond very well to conversations that go along the lines of:

“Look, you only need 38 marks for a C”

“You need less to get C than you got in your last exam”

“You only need 27 for a C. But you could get higher!”

Those conversations seem more positive than “Well, I suppose it is mathematically possible”!

KS4 template

It’s that time of the year again… when I revisit the Departmental Database and wonder how it could be developed and improved.

And this year, in addition, how to include the iGCSE into the growing range of qualification that we are offering.

So, last year, I was using a fairly basic =IF formula to compare the scores given by teachers into indicative grades. It was a little clunky and a little ‘Heath Robinson’ but it did the job.

This year, I am intending to use =VLOOKUP formulae to look the score given up in the table of grade boundaries on a separate sheet. It has taken a bit of time just inputting the grade boundaries (each possible score in each element of each qualification needs a grade allocated to it.

vlookup


Once done, however, the hope is that it will be straightforward enough to simply fiddle with and amend the grades accordingly. Obviously, the =VLOOKUP will amend itself according to the data entered on the lookup sheet. And alterations in grade boundaries can be applied and grades amended according to the changes in data that we have.

In terms of staff inputting, all I need will be the score for each Controlled Assessment or mock exam. With judicious use of protected cells and suspicious passwords, that should in fact be all that the staff can do.

Their “dashboard”, if you like, will look like this:

database template


Obviously there will be a range of data to be inputted for each child to track vulnerable groups, pupil premiums, intervention groups, withdrawal groups and accelerated groups – we have a tendency to generate five or six overlapping lists of students which no-one has any real overview of! – which can be done in anticipation of the start of term.

The database should also add up and / or average out scores for individual tasks to create the final figure to be entered into the OMR at the end of Year 11.

It should also be able to identify students whose Controlled Assessments pull down their raw ability; students who underperform in exams; students who might benefit most from specific forms of intervention.

One other item from the PiXL Club main conference that I liked was what I have dubbed micro-tracking.

This database is a broad-brush, specification wide tracking system. I intend to supplement it with a range of micro-tracking databases that track students’ success in individual exam questions to track their ability to perform certain skills rather than overall. A revision session on summarising skills for a select group of individuals persistently falling down on that skill will be more effective than a revision session on the OCR Information and Ideas Examination or the iGCSE Paper 1 or 2 which only touches on summarising. The same goes for directed writing skill, analysis skills, language skills, presentational devices responses or imaginative writing.

Additional sheets can be added at any time which could record mock exams on a question-by-question basis and a formula can easily add those up and record them in the main database.

Obviously, getting antiquated and somewhat Luddite staff to actually complete the database is another matter!